Interview Med Yuri Bezmenov
Immune overfor fakta og blinde for undertrykkelse, hvorfor?
For kort tid siden lyttede jeg til et 1983 interview med nu afdøde Sovjet defekter og KGB operativ Yuri BezmenovBezmenov var utrolig klarsynet, til en grad hvor man kunne have troet at interviewet havde fundet sted i 2010'erne.
Når jeg tænker på vejret og klimaet og hvordan vesterlandske folkemasser er total immune overfor repræsentation af bevislige fakta om vejr, klima og i hvilken grad vi måtte være i stand til at have nogen indflydelse, undrer jeg mig over hvoraf dette kommer. Jeg har de sidste 12 år beskæftiget mig med hvorfor klimaindustrien har fået så stor indflydelse og hvordan.
Interviewet med Yuri Bezmenov gav mig forklaring - og den var aldeles skræmmende - lyt selv (på engelsk):
https://www.youtube.com/watch?v=bX3EZCVj2XA
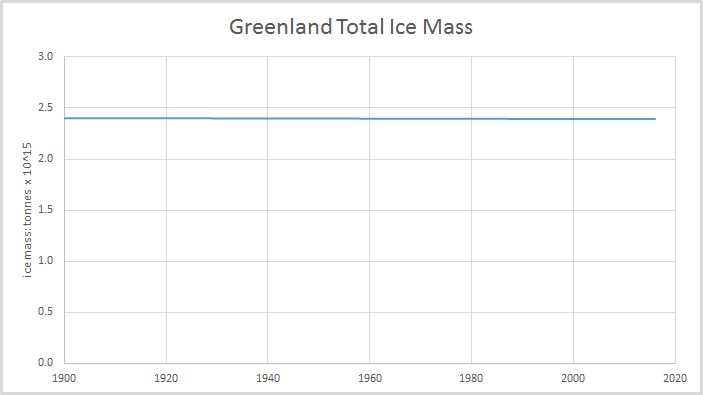
Grønland Ismasse 1900-2018
Grønland har mistet 0.4% af sin indlandsis over de sidste 100 år. Dette svarer til 0.004% per år, hvilket medfører at al isen vil være forsvundet om ca. 25.000 år; men inden da må vi antage at en ny istid spolerer chancen.
Total ice mass Fettweise et al. 2008 - Anommaly 1900 - 2009.
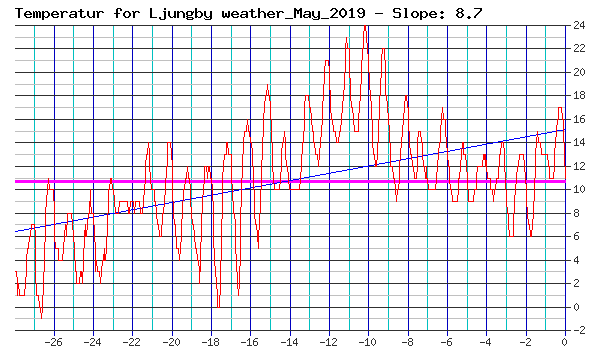
Temperaturen sidste 50år i Ljungby

Stats fra wolframalpha.com
Sunrise and Sunset is calculated from Ljungby Sweden @ Latitude +056.8322000 and
longitude +013.9353997 local time.
Sunrise


Sunset


Danish power generation:
Updates every 5 minutes.
Base Power: /4.25GW (%)
0.63 GW - 1953 - Coal, biomass, municipal waste
1.06 GW - 1959 - Coal
0.70 GW - 1968 - Biomass
0.07 GW - 1977 - Coal
0.81 GW - 1990 - Coal, biomass
0.38 GW - 1992 - Coal
0.06 GW - 1996 - Natural gas
0.15 GW - 1978 - Biomass, municipal waste
0.39 GW - 1997 - Natural gas (Block 3)
Varies Danish and English sources.
Note that most base power plants are supplying heat to local communities in addition to grid electricity.
Wind Power: /6.19GW (%)
The total capacity as of May 2020: 6.19
The figure is reported by ens.dk.
2019 average capacity factor:
CF = 8273 / 365 / 24 / 6.10 x 100 = 15%
This idea implies that we no longer need power from conventional power stations.
We would first need to have more windmills, so that practical CF covers max consumption plus energy loss.
Next we need batteries for when to sustain balance, inertia and times when the wind is weak.
Let us optimistically assume we will never have wind weak period of longer than 7 days and optimistically assume the a 7 day period of optimal wind will follow to recharge plus supply consumption.
Battery capacity would the need to be for 5 GW max consumption.
7 days (168hours) * 5 GW = 840 GWh or about 17 million 50 kWh electric car batteries to be replaced every 10 years or so.
The above 840 GWh estimation is just to give a pointer to the size of grid scale battery capacity needed, and it is extremely optimistic.
All these resources, seascape and landscape use could be avoided by using existing conventional power plants and forget the elite's expensive dream that sounds nature friendly, but is in fact:
The figure is reported by ens.dk.
2019 average capacity factor:
CF = 8273 / 365 / 24 / 6.10 x 100 = 15%
The Battery Solution
Many people, even on government level, suggest that we can rely on wind for 100% continuous of our electricity by installing batteries.This idea implies that we no longer need power from conventional power stations.
We would first need to have more windmills, so that practical CF covers max consumption plus energy loss.
Next we need batteries for when to sustain balance, inertia and times when the wind is weak.
Let us optimistically assume we will never have wind weak period of longer than 7 days and optimistically assume the a 7 day period of optimal wind will follow to recharge plus supply consumption.
Battery capacity would the need to be for 5 GW max consumption.
7 days (168hours) * 5 GW = 840 GWh or about 17 million 50 kWh electric car batteries to be replaced every 10 years or so.
The above 840 GWh estimation is just to give a pointer to the size of grid scale battery capacity needed, and it is extremely optimistic.
All these resources, seascape and landscape use could be avoided by using existing conventional power plants and forget the elite's expensive dream that sounds nature friendly, but is in fact:
- increasing the rates
- increasing the taxes
- increasing the nature destruction
- increasing the mineral depletion
- increasing the international dependency
- increasing the pollution

Import - Export last 28 days
Click title for graph
Chem-trails in Sweden
 Saturday 24 August 2024 at 07:45 direction south, Sweden. HAARP in Sweden and Norway controlled by Sweden.
Vejret de kommende dage i Ljungby
CurrentlyBanjul
Forgangne uge og forgangne måneds temperatur


May 2019:

May 2019:


Hvor meget CO₂ (kuldioxid eller kultveilte) er der egentlig i luften?
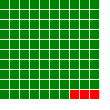
CO₂, som primært er planteføde tilsammens med sollys og vand, udgør ca. 400ppm eller 0,04% af atmosfæren. Af disse 0.04% udgør menneskets bidrag ca. 3%. Det vil sige at CO₂ fra mennesket udgør ca. 0.001%.På billederne for neden, forsøger jeg at illustrere dette rent grafisk.

Der er et CO₂ molekyle for hver 2500 molekyler i vor atmosfære.
På billedet kan du se det grønne kuldioxid molekyle i nederste højre hjørne.

På billedet kan du se det grønne kuldioxid molekyle i nederste højre hjørne.


Circa 3% af CO₂ molekylerne stammer fra menneskelige aktiviteter.
På billedet kan du se 97 grønne kuldioxid molekyler og de 3 menneskeskabte CO₂ molekyler.
På billedet kan du se 97 grønne kuldioxid molekyler og de 3 menneskeskabte CO₂ molekyler.